
Discover trends
shaping the future
Vectora helps you visualize, track, and analyze emerging trends across industries, turning complex data into insights you can act on.
Intelligence built
for the trend economy
Every feature in Vectora is designed to help you see tomorrow, today.
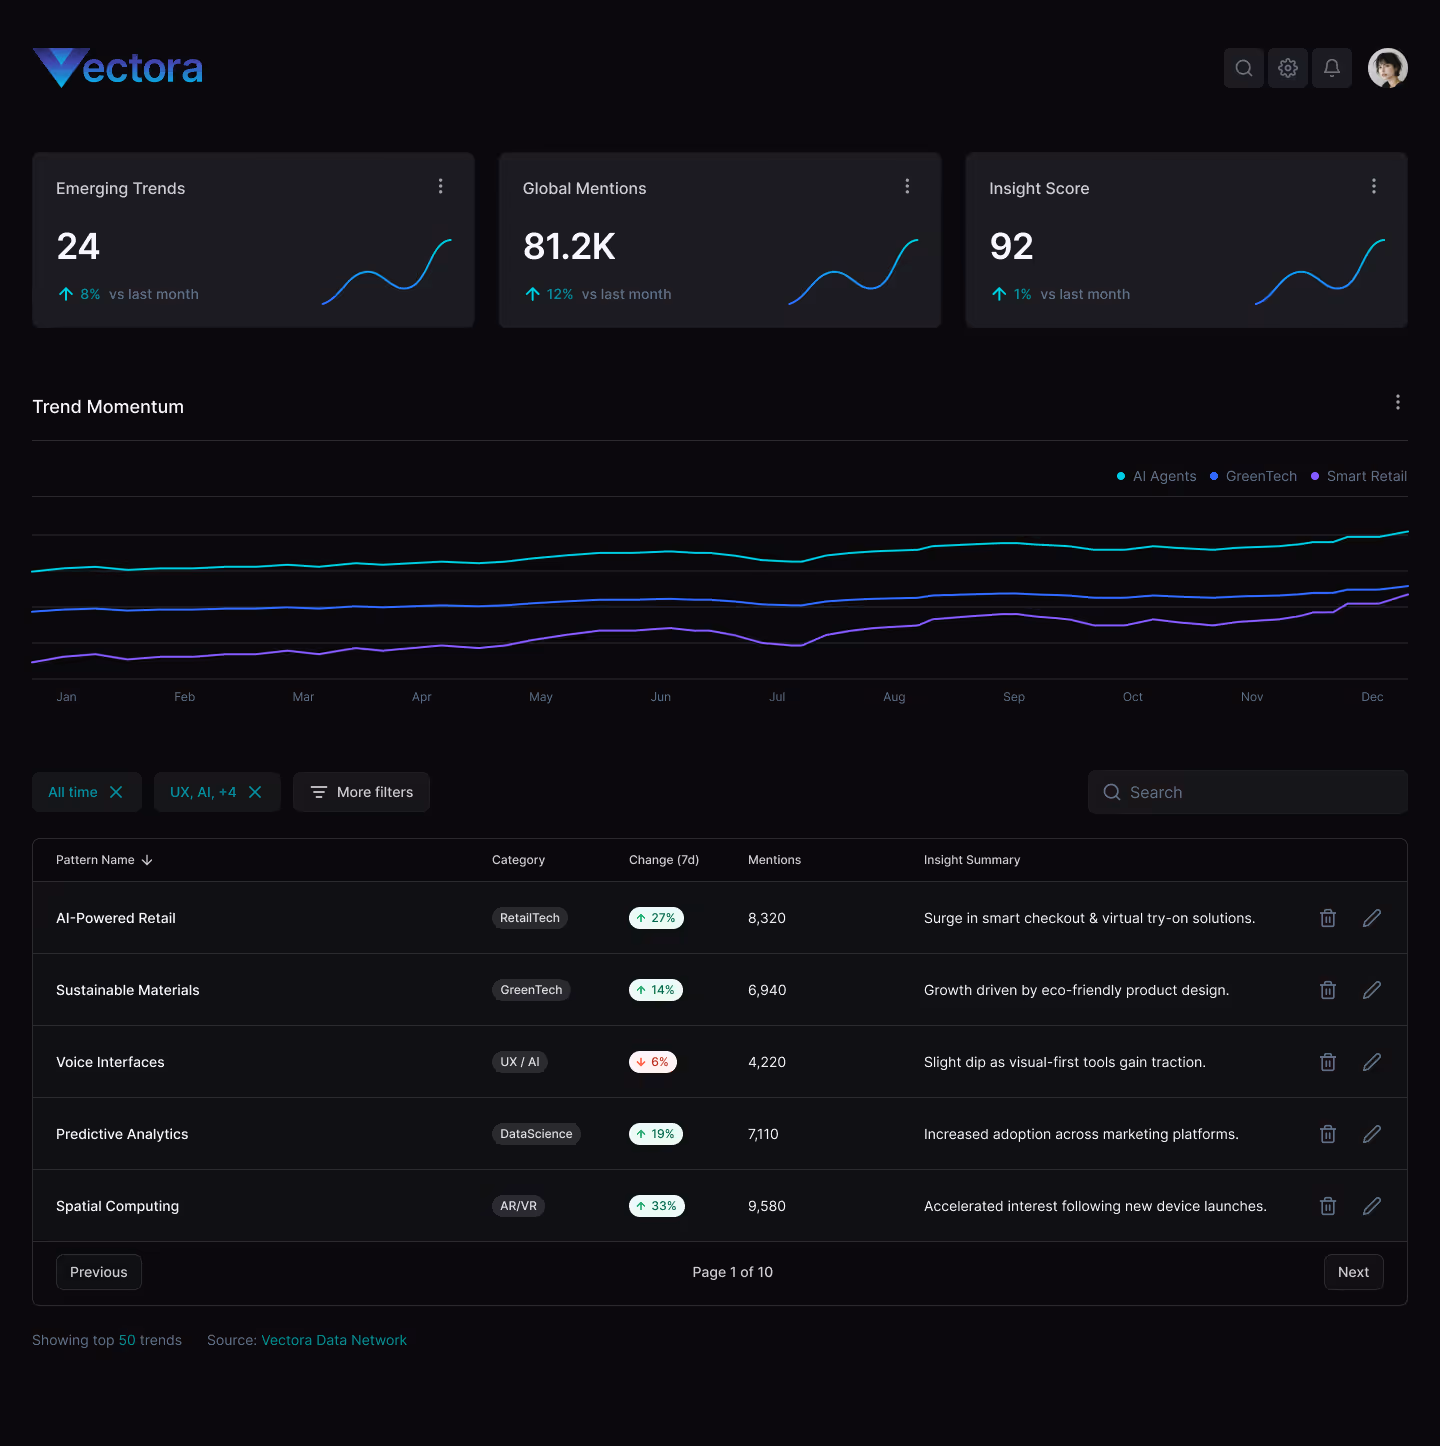
Trend Intelligence Dashboard
Track trending topics, keywords, and shifts with live visual updates.
AI-Driven Insights
Discover hidden relationships between industries, startups, and technologies.
Custom Libraries
Build your own collections of trends and patterns to monitor specific markets.
Collaboration Tools
Share dashboards, annotate insights, and collaborate with your team in real time.
From signals to strategy
Vectora captures millions of data points across industries, media, and consumer behavior, transforming them into clear visual patterns that reveal what’s next.
01
Collect
Aggregate real-time data from curated sources
02
Analyze
Identify key signals and correlations
03
Visualize
Turn data into intuitive charts, heatmaps, and trend cards
04
Execute
Export insights or share dashboards with your team
What future thinkers say
“Vectora helps us spot market shifts weeks before they show up anywhere else. It’s like having a window into the future.”
Maya L.
Innovation Strategist, Nuvex Labs
“We replaced hours of research with real-time dashboards. The clarity Vectora provides is incredible.”
Ethan R
Head of Insights, Orbit Agency
“The interface is so clean and immersive — complex data finally makes sense at a glance.”
Sofia T.
Trend Analyst, Apex Collective
“Vectora turned our static reports into living, evolving insights. It’s a total game-changer for our clients.”
Noah K.
Market Research Lead, VisionPoint
“Seeing patterns emerge in real time completely changes how we make strategic decisions.”
Claire D.
Director of Strategy, Lumina Partners
“From data to direction — Vectora bridges that gap beautifully.”
Leo F.
Product Strategist, NextFrame AI
“Finally, a tool that captures the pulse of change and turns it into actionable intelligence.”
Hannah P.
Foresight Consultant, DeltaEdge
“Vectora helps us evaluate industries with more confidence. The trend correlations are gold.”
Arjun S.
Investment Analyst, CoreVentures
“The visualizations alone are worth it — everything feels alive, like data storytelling done right.”
Ivy M.
Creative Director, NovaWorks Studio
“We use Vectora daily for client briefs. It’s the first tool that makes data beautiful and usable.”
Ryan T.
Research Manager, Insightful Co.
“Our team now identifies early signals we used to miss completely. Vectora changed how we plan ahead.”
David K.
Head of Innovation, ModeLab
“From startups to global shifts, Vectora connects the dots in ways we never thought possible.”
Juno P.
Data Researcher, TrendWorks
Frequently asked questions
Answers to common questions about Vectora, trend insights, and how it helps your team see what’s next.
What is Vectora?
Vectora is an AI-powered trend intelligence platform that helps teams track emerging patterns, visualize market shifts, and make data-driven decisions. It transforms complex data into clear, interactive insights.
Who is Vectora built for?
Vectora is designed for strategists, researchers, agencies, and innovation teams that need to monitor market signals, forecast trends, and uncover new opportunities.
How does Vectora find and track trends?
Vectora collects millions of data points from reliable sources — including media, research, and market activity — then uses AI models to identify patterns, correlations, and momentum across industries.
Can I create my own trend collections or dashboards?
Yes. You can build custom libraries and dashboards to focus on industries or topics that matter most to you. Organize insights by category, growth rate, or emerging potential.
Does Vectora integrate with other tools?
Vectora supports export options and API connections (coming soon), so you can share insights with tools like Notion, Slack, or Google Sheets.
How often is the data updated?
Data refreshes daily to ensure trend signals remain accurate and timely. You’ll always have access to the latest market movements.
Is the dashboard customizable?
Absolutely. The dashboard is modular and flexible — users can personalize layouts, filters, and color themes to match their workflow or brand.
Can multiple team members collaborate?
Yes. Vectora includes built-in collaboration tools so teams can annotate insights, share dashboards, and discuss emerging opportunities in one place.
What pricing plans are available?
Vectora offers flexible plans for individuals, startups, and enterprise teams. You can start free, explore core features, and upgrade when you’re ready for advanced analytics.
Latest trends shaping the future
Stay ahead with real-time insights from across industries, markets, and innovation ecosystems.


See what’s next.
Stay ahead.
Join thousands of innovators tracking the patterns defining tomorrow’s industries.